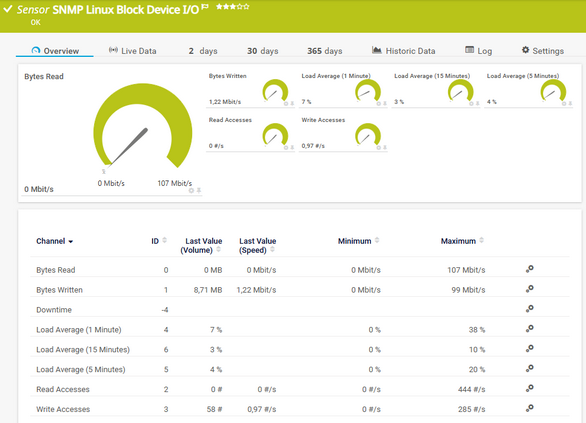
PRTG Manual: SNMP Linux Block Device I/O Sensor
The SNMP Linux Block Device I/O sensor monitors the input/output (I/O) of a block device on a Linux/Unix system via the Simple Network Management Protocol (SNMP).
For a detailed list and descriptions of the channels that this sensor can show, see section Channel List.
- Dutch: SNMP Linux Block Device I/O
- French: SNMP Linux Block Device I/O
- German: SNMP Linux Block Device I/O
- Japanese: SNMP Linux Block Device I/O
- Portuguese: SNMP Linux Block Device I/O
- Russian: SNMP Linux Block Device I/O
- Simplified Chinese: SNMP Linux Block Device I/O
- Spanish: SNMP Linux Block Device I/O
Consider the following remarks and requirements for this sensor:
Requirement |
Description |
|---|---|
Credentials |
This sensor requires credentials for SNMP in settings that are higher in the object hierarchy. |
Management Information Base |
This sensor uses data found in the UCD-DISKIO-MIB::diskIOTable Management Information Base (MIB) module. |
IPv6 |
This sensor supports IPv6. |
Scanning interval |
This sensor has a fixed minimum scanning interval for performance reasons. You cannot use a shorter scanning interval. Consequently, shorter scanning intervals in the Monitoring settings are not available for this sensor.
|
Performance impact |
This sensor has a very low performance impact. |
Multi-platform probe |
You can add this sensor to a multi-platform probe. |
Knowledge Base |
Knowledge Base: Why did my SNMP Linux Block Device I/O sensors stop working after I changed my SNMP version? |
The sensor has the following default tags that are automatically predefined in the sensor's settings when you add the sensor:
- iosensor
- snmp
- snmpiosensor
For more information about basic sensor settings, see section Sensor Settings.
Setting |
Description |
|---|---|
Block Device |
Shows the block device that this sensor monitors.
|
64-Bit Values Available |
Shows if the 64-bit X-values are available in the diskIOTable:
|
Load Averages Available |
Shows if load averages are available for this block device:
|
Setting |
Description |
|---|---|
Primary Channel |
Select a channel from the list to define it as the primary channel. In the device tree, PRTG displays the last value of the primary channel below the sensor's name. The available options depend on what channels are available for this sensor.
|
Graph Type |
Define how this sensor shows different channels:
|
Stack Unit |
This setting is only visible if you select Stack channels on top of each other above. Select a unit from the list. PRTG stacks all channels with this unit on top of each other. By default, you cannot exclude single channels from stacking if they use the selected unit. However, there is an advanced procedure to do so. |
Setting |
Description |
|---|---|
Result Handling |
Define what PRTG does with the sensor result:
|
By default, all of these settings are inherited from objects that are higher in the hierarchy. We recommend that you change them centrally in the root group settings if necessary. To change a setting for this object only, click ![]() under the corresponding setting name to disable the inheritance and to display its options.
under the corresponding setting name to disable the inheritance and to display its options.
For more information, see section Inheritance of Settings.
Which channels the sensor actually shows might depend on the target device, the available components, and the sensor setup.
Channel |
Description |
|---|---|
Bytes Read |
The number of bytes read
|
Bytes Written |
The number of bytes written |
Downtime |
In the channel table on the Overview tab, this channel never shows any values. PRTG uses this channel in graphs and reports to show the amount of time in which the sensor was in the Down status. |
Load Average (1 Minute) |
The load average (1 minute) (%) |
Load Average (5 Minutes) |
The load average (5 minutes) (%) |
Load Average (15 Minutes) |
The load average (15 minutes) (%)
|
Read Accesses |
The number of read accesses |
Write Accesses |
The number of write accesses |
KNOWLEDGE BASE
How do I set up SNMP on Linux?
What security features does PRTG include?
My SNMP sensors don’t work. What can I do?
Why did my SNMP Linux Block Device I/O sensors stop working after I changed my SNMP version?
PAESSLER WEBSITE
How to set up limits in PRTG in 4 steps


